Fax: 07 5452 7301
Email: nathan@ffsolutions.com.au
Latest News
As share prices rise, the risk-return trade-off gets tricky Part of Vanguard's Global Macro Matters research series.
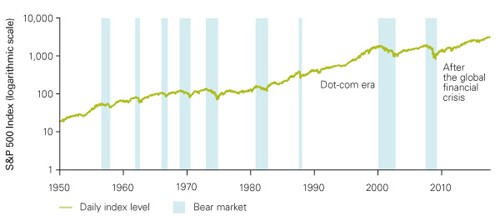
In the eight and a half years since the lows of the global financial crisis, the Standard & Poor's 500 Index has climbed more than 250%, making the current bull market the second strongest – and the second longest – since 1926 (see Figure 1). The dot-com boom of the 1990s, when the index climbed more than 400% over nine and a half years, holds the record in both categories. This comparison raises inevitable and uncomfortable questions. Can the bull market continue to charge much higher? And, more important, are we in a late-1990s-style bubble, when valuations reached record highs and share prices subsequently plunged by 50%?1 Figure 1. The S&P 500 is in its second-strongest bull market Notes: Data shown are for the S&P 500 Index from 1 January 1950 through 23 October 2017. "Bear market" is defined as a period with a decline of 20% or more from the previous high. Sources: Vanguard calculations, using data from FactSet and Bloomberg. Our analysis finds that:
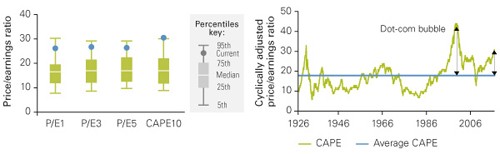
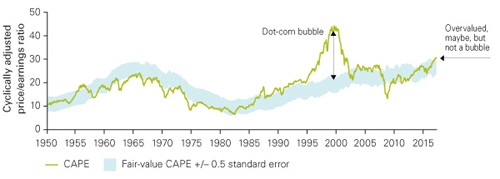
Conventional valuations are unusually high Whether we use one-, three-, five-, or ten-year average earnings in the denominator, P/E ratios are quite high. The four valuation ratios in Figure 2a are between the 89th and 95th percentiles relative to their historical levels. The CAPE is at the 95th percentile of its historical levels. As Figure 2b shows, it stands at 31x, just below two standard deviations from its long-term average of 18x since 1926. By just about any conventional measure, equities are overvalued. Figure 2. The S&P 500 Index is unusually high relative to history Note: Analysis above is for the S&P 500 Index since 1926. Sources: Vanguard calculations, based on Robert Shiller's website, at aida.wss.yale.edu/~shiller/data.htm. The fair-value CAPE tells a less alarming tale In Vanguard's Economic and Investment Outlook for 2015, we introduced a fair-value CAPE that accounts for current interest rates and inflation levels.3 This fair-value concept provides a more useful time-varying benchmark against which the traditional CAPE ratios can be compared. Figure 3 plots the Shiller CAPE versus our fair-value model since the 1950s. In the late 1990s, the difference between these two would have suggested a bubble. Today, the CAPE is approaching historical highs, it's only marginally higher than our estimate of its fair value. In other words, the Figure 3. The Shiller CAPE is approaching overvalued territory Notes: Fair-value CAPE is based on a statistical model that corrects CAPE measures for the level of inflation expectations and for lower interest rates. The statistical model specification is a three-variable vector error correction (VEC), including equity-earnings yields (S&P 500 Index), ten-year trailing inflation, and ten-year US Treasury yields estimated over the period from January 1940 to September 2017. For details, see Vanguard's Economic and Investment Outlook. Sources: Vanguard calculations, based on Robert Shiller's website, at aida.wss.yale.edu/~shiller/data.htm; the US Bureau of Labour Statistics; and the Federal Reserve Board. Implications of high US equity prices, low yields
Figure 4. The benefits of global diversification are more compelling than usual Notes: Summary statistics of 10,000 VCMM simulations for projected five-year annualised nominal returns as of September 2017 in US dollars before costs. Historical probabilities are probabilities of a 10% or worse decline in any given year for rolling five-year periods and are calculated from 1960 onward based on calendar-year returns. The global equity portfolio is 60% US equity and 40% global ex-US equity. The global bond portfolio is 70% US bonds and 30% global ex-US bonds. Balanced portfolios include global equity and global bonds. For VCMM details, see Vanguard Global Capital Markets Model.2 Investing is always a balancing act between return objectives and risk preferences. Given current valuations, risky portfolios appear to offer low return with even-higher-than-usual odds of loss, while a global balanced 60% stock/40% bond portfolio offers an unusually compelling trade-off. The next few years could be challenging for investors, who may have to navigate an environment with low returns and a compressed equity risk premium. Decisions around saving more or spending less will be as important as staying diversified and controlling costs. Adhering to investment principles such as long-term focus, disciplined asset allocation, and periodic portfolio rebalancing will be more crucial than ever before.
Research & Commentary ----------------------------------------------------------------------------------------------- 1 The CAPE ratio rose more than three standard deviations above its long-term average in the late 1990s and early 2000s, and thus the period can be considered extremely overvalued or a bubble. |